Creating Data Enabled Culture
Creating a Data-enabled Culture
I think the term data-driven is common, and a lot of people are aware of
the term. It also has a broad area of application across many practices. I feel my Org is already data-driven. We use
data in all our metrics, planning, discussions, collaboration and more. However, today during a cross team meeting I
realized that we are also a data-enabled organization. When the term popped into my head I thought maybe I was on to
something new, or perhaps maybe something a bit esoteric. Turns out, I was wrong, and this term is commonly used in areas already.
A quick Google search will show lots of results for data enabled, and here
is a blog post I found from the first page of results.
I have a previous series of blog posts on the topic of being data driven, which starts here with Part I.
This small series of blog posts goes over just some ways we have become a data-driven organization, but during my
data journey I have been slowly realizing that we are also very much a data-enabled organization. I think this is very
important to observe and reflect upon. Giving your IT staff access to data enables them to just do the work, to just get
the answers and to collaborate and share those answers with other people and teams.
Data Sharing is Data Caring ♥️
It all starts with data sharing. With products like Snowflake you can easily share data amongst teams and people. Having access to raw data from many sources allows us to always be data-enabled. You learn to stop making assumptions, anecdotal hypothesis, educated guesses, hunches, or good old-fashioned “gut-feelings” when it comes to your IT and Operations data. If you are an organization that already ships all your data to a platform like Snowflake and you have given your employees the proper access, and opportunity to leverage the data, you are now walking the path of being data-enabled.
Some of the data we leverage:
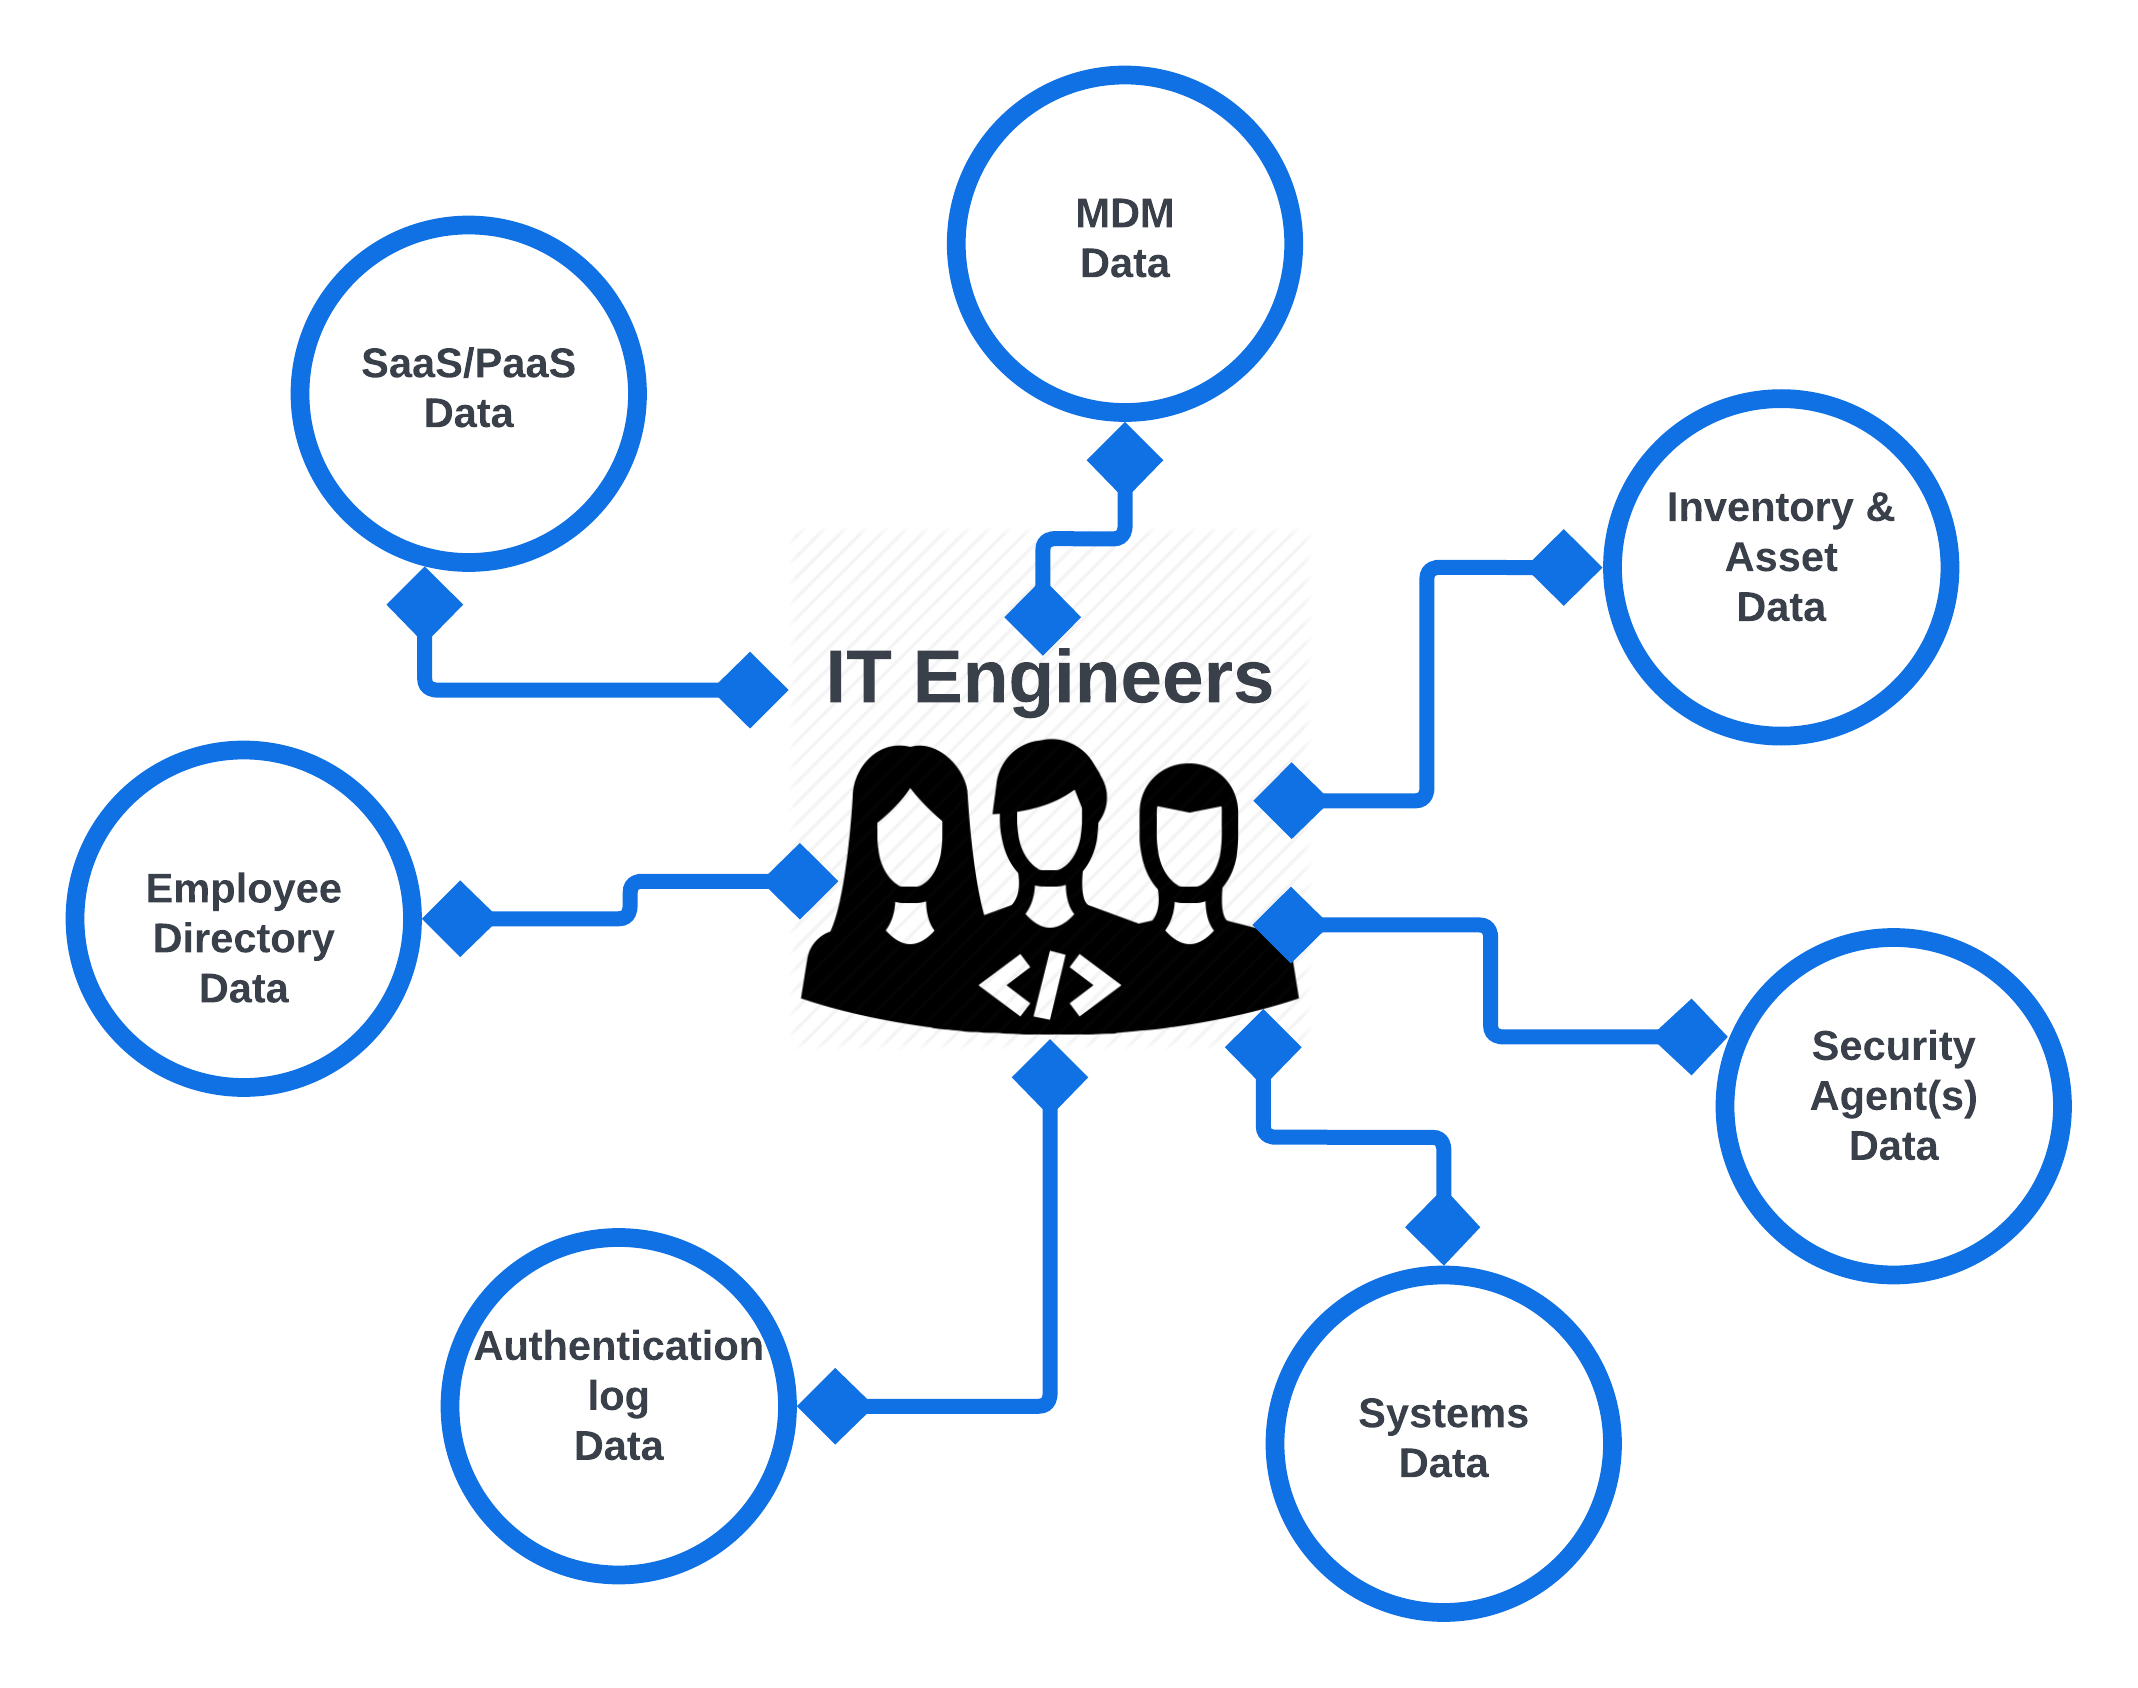
MDM Data- Intune and Jamf ProInventory & Asset Data- Asset tracking from ServiceNowSecurity Agent Data- Vuln scans, EDR/DLP agents, backup logs, etcSystems Data- osquery data, metadata from MDM, results from data collectors, etcAuthentication Log Data- If you are authenticating to the IdP we can assume you are working (and not on PTO)Employee Directory Data- Name, department, email address, manager, FTE/Contractor, etcSaaS/PaaS Data- Data from our SaaS apps and Cloud Services
When you have all the raw data already available to you, and data pipelines delivering continuous up-to-date data, you can enable your IT Organization to be data-enabled. This is very much a game changer, and even a shift in culture, capabilities, collaboration, and much more. All the data is already there, you just need to work with it. Data sharing among teams and organizations is what helps enable this. This is the future of how Organizations gain IT insight.
Applying this in Everyday Life
There have been many times in my data journey so far where I have had to unlearn past things, and I have had to admit that things I thought that were solid answers throughout my career were oftentimes not quite right. Reflecting upon this, there were times when I was mostly-right, and there were times that I was likely way off. Humans can develop a plethora of different biases which can stray us for the actual truth. This is why I have started to train myself to not make assumptions, but instead to put my assumptions in the form of a data query, and ask the data a question. We always trust, but verify the results and ensure the data in our data sources is in fact valid.
I was recently in a conversation about a specific piece of data around an application vulnerability. The data was showing around 400 vulnerable instances of this application, and looking through the data I noticed that the vuln scan agent was picking up applications that were in end user’s downloads folder. This is an old problem we discovered through data a few years ago, and I already have a solution to check against our fleet on this. My colleague and I had a discussion about this, and I proposed that there were probably at least equal amount of instances of this vulnerable application in random download folders across our fleet. My colleague guessed that was way too high and the number was likely a lot smaller. So off to our data we went, and I ran my user space application query. The results returned 463 instances of that Application in user space. To me, this is an example of how being data-enabled comes into play in our day-to-day work lives. We knew this was a possibility from previous project work, I had already built a tiny tool to collect user space applications, and we were already ingesting that data into Snowflake. I even already had a dashboard built for this. Having all this data available to us at the tips of our fingers is what really helps us be data-enabled.
In my meeting today with my sister teams, we were discussing how to tackle some stragglers in our post Nudge campaign to update macOS across our entire fleet. The campaign was already a large success numbers wise. We had some of the fastest adoption times we have seen by ditching our old macOS update flows in favor of this. We also have all the data for it too! One of the talking points that was brought up, was how to improve the existing data to help enable our support teams to better assess and distribute the work to go troubleshoot our devices that are in a weird state or experiencing the known software bugs we are trying to patch to fix. My colleague asked if we had other data values we could add to the existing dashboard to help make their job easier. Since we already have all this data available we are already enabled to make changes to the queries to give our colleagues more actionable and better data. Sure I now have to rewrite some queries and that is additional work for me or my team to do, but the fact is we already have all the data. We already have all the data pipelines with continuous data ingestion, and we are fully enabled to leverage the data to make it work for us. During our cross team meeting it felt as if we were all on the same team together looking at the data. We collaborated and formulated a plan to make improvements to our existing dashboards and queries. My team is helping provide a service to another team. This was possible due to us all being data-enabled.
Enabling Others
Another thing that really reigned in with me this week, is that the dashboards we create are all cross team functional for the most part. Sure, there are definitely a few dashboards that are specific to my team, and I can imagine other teams might have their specific dashboards as well. However, I find that our queries and data are very much applicable to other people and team’s interests. When we rolled out our mTLS password-less authentication app here, I made a dashboard for the project. I had stakeholders from various teams asking me for data often, so I just enabled other people to get the data whenever they wanted. All that had to do was to load the dashboard and hit the play button, and then a few moments later they got the latest up-to-date data. We enabled everyone to get the data on demand when they wanted to.
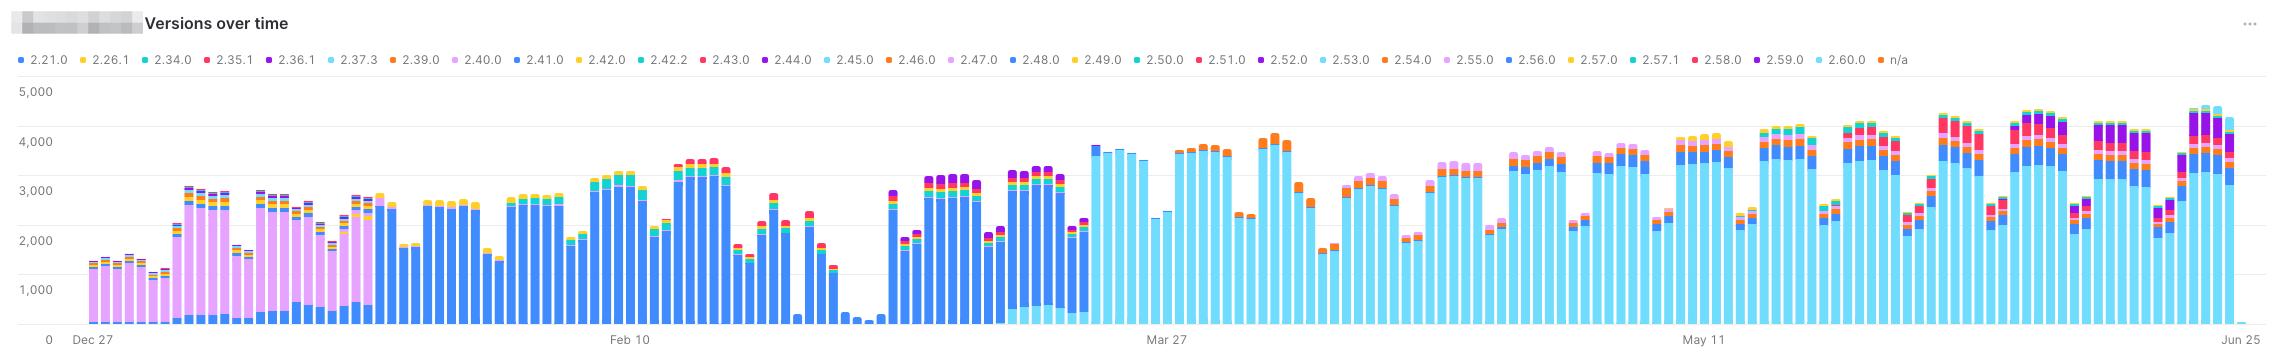
In the above screenshot is just a time series data of the version of the app we deployed over time. There are many other bits of data in this dashboard, so this is just one piece of information from it. In the beginning this very useful to see what versions our fleet was at, how well the self updating mechanism was working from the vendor, and we could correlate bug fixes and enhancements from the release notes to our support tickets. Things like if a bug fix was released in a specific version, we could see what version the fleet was and then tie those to support tickets for the problem that the new release fixed. This allowed us to better forecast our support costs to the app, and track when a problem was fixed by a new release. Project managers, architects, leadership, support folks, and so forth could just go to the dashboard and run the update button. I just enabled them to get the data whenever they wanted it.
Build It!
One time at a new employee on-boarding training I heard someone say, “The second most valuable thing in this room is the new laptop you are receiving, with the most valuable thing being you.” People do make up the organization, and hiring the right people is a good start to building a data-driven culture, and also a data-enabled culture. Managers should encourage professional development around the skills that are needed to accomplish this, and the organization should invest in its people to train them. Socialize data sharing and let data be free and open among teams. Gate-keeping data doesn’t help anyone outside the data owners, and it doesn’t enable the rest of the organization to leverage that data. Don’t silo your data, don’t keep other teams in the dark, and instead enable them to be successful with all the data you can.
To me this is the future of how IT and Operations shops leverage their data to make the absolute most of it, enable their colleagues to be informed, and to gain the most insight you can about your technology stacks.