Shipping Jamf Webhooks with Fivetran
Shipping Jamf Pro Webhooks to Snowflake
Jamf Pro has a builtin feature where you have the ability to ship a webhook event when specific events happen in their application. This allows for a near real time feed of event based data which you can consume and leverage to gain insights about your fleet. Jamf provides some documentation online, found here.
Webhooks are generated automatically, and near instantly when an event occurs. In the linked documentation above you will see all the possible webhooks and sample data of what each webhook ships. There are many ways to ship webhooks, and you can choose from many paths to take. You can roll your own webhook receiver, you can ship webhooks directly to cloud storage (S3, Azure Blob, GCP Cloud Storage), use one of many data ingestion tools, and so forth. Right now we are leveraging a tool called Fivetran. Fivetran has built in integration to many SaaS and cloud services. What tools work best for your Organization will be up to your Org to decide.
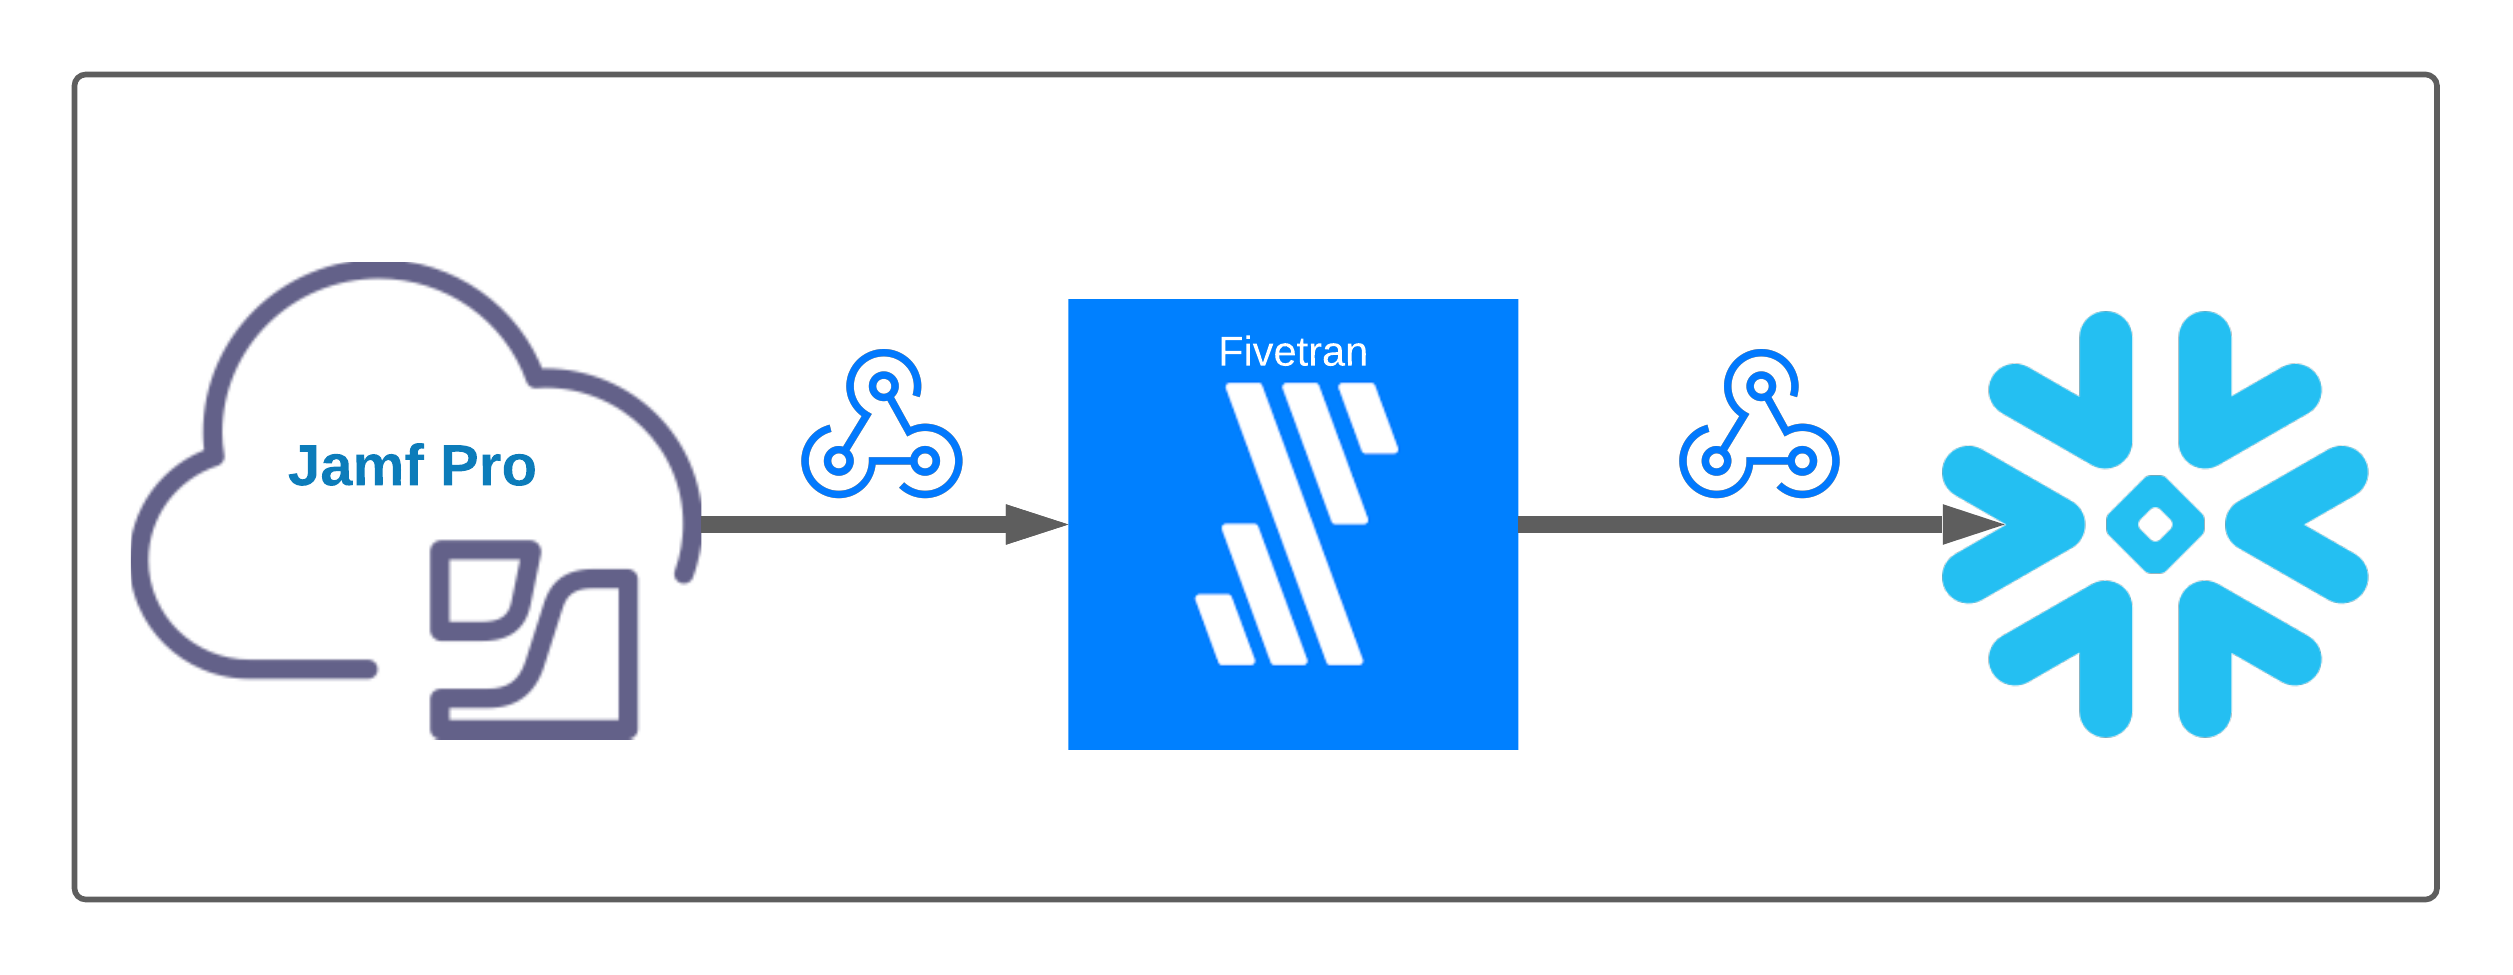
Here is how the data flow looks:

First we need to configure Fivetran Snowflake Connector
After that create the database in Snowflake, for reference here is the documentation
This blog post assumes you have this operating and working, as every Org might have different configurations or requirements in their apps, please refer to the official documentation to ensure this is working. With in Snowflake you can have many warehouses, databases, schemas, and a wide range of RBAC controls in place. So, you may need to adjust some knobs to get this to work.
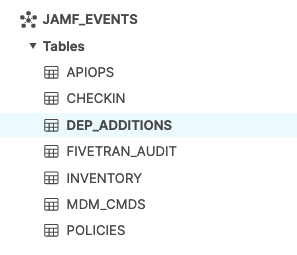
Here is what I have created in my dev account:

If you have your database setup now we need to log into Fivetran and create our connector. Find the Webhook Conector with in Fivetran and create a new one. You will want to make sure you already have the database in place and Fivetran has the proper RBAC on that table for data ingestion.
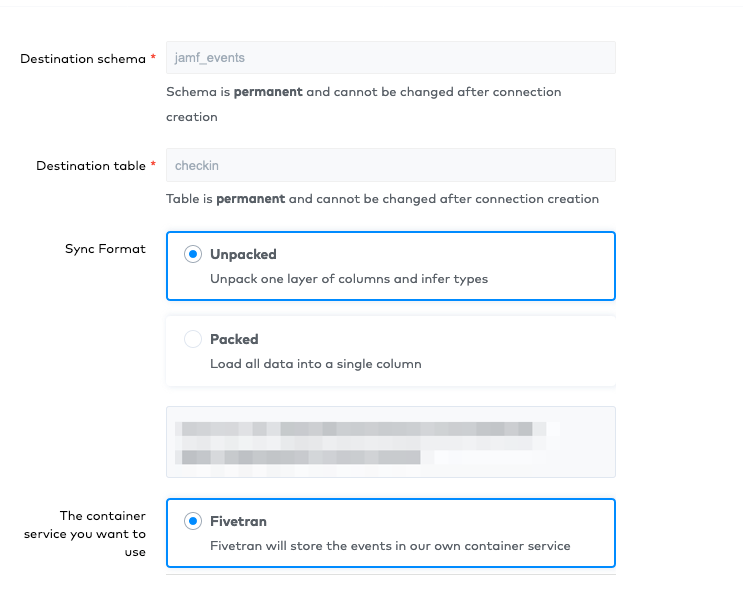
Here is an example:

There will be a Webhook URL once created which you will need to configure in the Jamf Pro Server. Navigate to Settings >
Global Management > Webhooks. Create a new webhook, select the event you want to ship (above example was ComputerCheckin),
and make sure you select JSON as the data type. Input the URL you generated in Fivetran and any other options you would
like to tweak. You can see that I have my schema set and the table set that matches my dev account in the screenshots.
For reference:

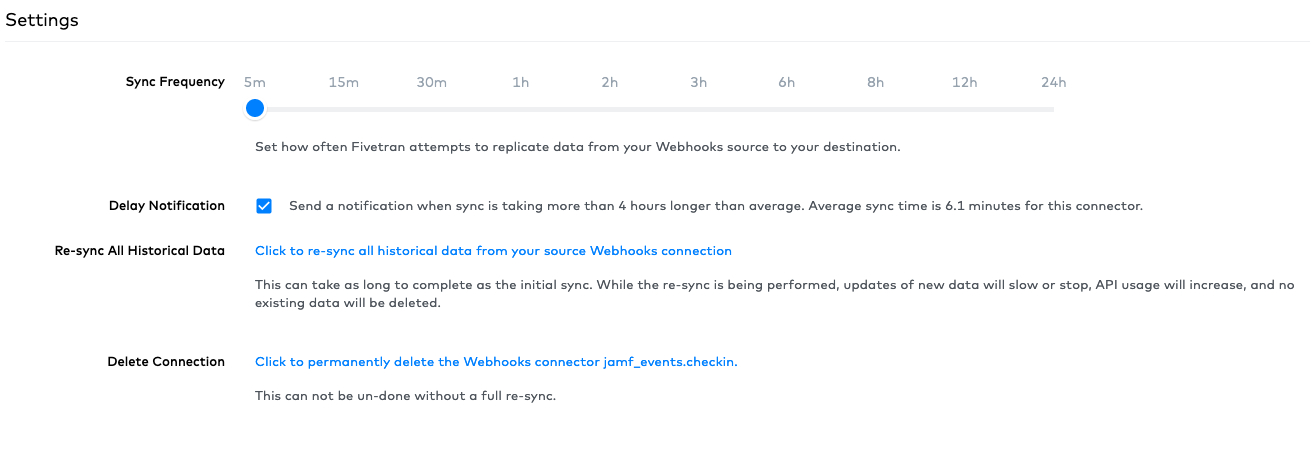
In Fivetran you can select how often data synchronizes with Snowflake. Since Webhooks are event based data, it is my opinion that the faster you can consume the event, the more valuable that data is. So, I have chosen to ingest every 5 minutes. If you want to pick a different time, you may do so. Your Org may have different needs or requirements, but I do strongly suggest you ingest the webhooks as fast as you can. For example, if you are building data around events, the event based data is more valuable if you can get it in near-realtime. Below are the settings I have configured.

So that is it! Just repeat this process for each webhook event you wish to ship to Snowflake. Now you can let the data flow right in, and you are ready to query some of the data and get intelligence off of it.
Now for some fun. If you want to find out how many times a specific Policy ID has ran on your fleet with in a specific
time frame you can do this quite easily. Since Snowflake is highly scalable and allows one to store massive amounts of data
you can keep all your historic data as you see fit. Here is an example query:
|
|
NOTE: Jamf Pro Webhooks ship with UTC millisecond epoch time stamps
| COUNT(*) | POLICY_ID | JSS_ID | STATE |
|---|---|---|---|
| 2 | 256 | 2240 | true |
In the above output we can see that Policy ID 256 has executed twice in the past 24 hours, and it has returned successful.
We also know the JJS ID of the device that ran this policy, and it is the same computer. This would allow Jamf Pro
Admins to really leverage webhook data and get near-real time results on specific polices, or all policies.
You can track what your fleet is doing by webhook event. This is normally data that is not even exposed to the Jamf Admins at all. Like how many inventories is each device doing? I have found some interesting things parsing this data, another query example:
|
|
Output:
| INVENTORY_24HR | ID |
|---|---|
| 1 | 4363 |
| 1 | 1577 |
| 1 | 4520 |
| 2 | 4132 |
| 2 | 2750 |
| 2 | 4319 |
| 3 | 1600 |
| 37 | 3272 |
Look 👀 at that computer, JSS ID 3272! This is older data, and I wanted to use this as an example of how powerful data
can be. That device spammed inventory to the Jamf Pro Servers 37 times in 24 hours. Upon inspecting the device record
there was nothing in scope that called a recon so I was at a loss as to why this device was spamming my cloud tenant with
inventory updates. Turns out the binary/agent on the client was in a weird state. When I find these, typically having the
user reboot their computer fixes it. In some cases we need to remove Jamf and re-enroll the device. Jamf does not provide
this data to you at all in the web console. However, if you ship and collect webhooks you can track this yourself. You can
also keep the full historical data and trend it over time.
One last example that is a nice to have, is being able to track what devices are in DEP. Apple does not have a very good way of getting data from ABM/ASM about all your devices that are DEP Enabled. Jamf Pro will ship a hook anytime a DEP Device is added to a prestage. So, while this is not directly from Apple, it is at least something to help track all your DEP devices and no one has to log into ABM/ASM to do this. Since it is in Snowflake, you can Data Share it as well to asset/inventory folks.
|
|
The above is just a count, so it will return how many devices are in DEP. However, since Snowflake can ingest and parse JSON data natively, you can query anything from the webhook itself. Here is an example webhook taken from Jamf’s documentation linked near the beginning of this post:
|
|
So you would be able to grab all those data points around every device you have in ABM/ASM, and the Webhook event would generate and ship to Snowflake almost instantly after it happens.
So, this is a quick guide to a few of the things we are doing with Webhooks in Snowflake. As time permits I will post more about the benefits of having data about your fleet. I know I also did not show off any visualizations of data in this post. You can definitely visualize all this data. I will try to post some of our sanitized visualizations, or post examples in the future. In the meantime, if you feel this is valuable and would like to also leverage this as much as we do, I have a feature request you should up-vote here