Contents

Working with osquery Data in Snowflake

I recently told my dog, Booms, all about how you can use osquery data in Snowflake. Needless to say, he was quite impressed with all the use cases and in-depth data you can model about your fleet of laptops using osquery data in Snowflake.

/img/booms-snow1.jpg

Booms came to the office with me, and he even got a bit of company swag! As we spent the day working I told him all about all the work my team was doing with osquery. Anyone can see in this pic of him, he is very impressed with the speed and scale one can leverage data from osquery in Snowflake

Quick Recap

A while ago I posted a blog about osquery, FleetDM, and Snowflake. You can find my old blog post, here We are now using this tech stack even more today, and while we have been working on many other different projects we have made progress with our osquery story. If you are unfamiliar with FleetDM, osquery or Snowflake I suggest you read the previous blog post. The basics are covered there.

Our setup is FleetDM managing osquery, integrated with Snowflake. Leveraging AWS cloud technologies like S3 storage, and Kinesis Firehose to stream data in near-real-time. With Snowflake’s Snow Pipe to rapidly ingest data, so we can get data as fast as we choose to.

Some Problem Statements

People may be curious as to why we want to deploy more tools to collect data, when there are things like MDM that most IT Operations shops already have. The simple answer is that osquery is just way better at collecting data, it is cross-platform, and it gives us much better control over our data pipelines. So, here are some things we are initially trying to solve:

  • Proactive monitoring
  • Performance monitoring
  • Security and Compliance data
  • Extended software gathering
  • Bridging gaps in current data collection features our or tech stack

We have many more use cases, but we will continue with the above. One of the problems IT has always faced, is the ability to predict when a device is going to have problems and proactively help or fix/replace an end user device. Security will want all the sweet data that osquery can provide, you just have to inform them you are able to leverage osquery, and they will have asks.

Performance data is tough to track on end user devices. Unlike server infrastructure, end users can do, well anything they desire to do. Like run tons of apps, configure their technology how they see fit, and develop workflows that you have zero insights to. Your end user’s workflows may be very foreign to you as well. IT folks may have no idea what a marketing or sales staff may do. Professional services folks are a great x-factor to mention as well. They do all sorts of things customers ask them to do. So, tracking an end user device’s performance can be a great way to tell if you are over/under spec’ing the device, or if certain applications on the device are potentially not optimally configured, etc. However, none of this should stop you from trying to understand what your coworkers do day to day, and how you could potentially help with data.

/img/booms-blink.jpg

Booms felt skeptical that we could pull this off at scale. I told him we would never know if we didn’t try

A Decent Start

Before I dive into what we have done, and how we have leveraged the data, I would like to mention that we have not turned on any events based tables in osquery yet. So, the performance data we have is a snapshot in time, of the most expensive compute processes since boot time. The caveat with this data is that it doesn’t tell us how long these processes ran. If a process runs at 900% cpu usage from a 10core CPU system for 5 seconds, is likely a different story than a process running at 500% CPU usage for 25 minutes on that same system. As well as a process taking up 5 cores on a 6 CPU core system, versus 5 cores on a 10 CPU core system. While we do not have the full on events’ data yet in osquery, we do have something to start with.

Event tables in osquery are a bigger compute cost to leverage. We plan on exploring these tables, but we take UX of our laptops as a high priority. So, the enabling of the events’ data in osquery will be a slow roll-out while we monitor any potential impacts we could potentially encounter. I would also like to point out, tons and tons of effort has gone into making osquery much more performant over the years. So, if you have not tried a modern version of osquery I would recommend that you give it another go!

Let’s look at some data!

Consider this query in osquery:

 1
 2
 3
 4
 5
 6
 7
 8
 9
10
11
12
13
14
15
16
17
18
19
20
21
22
SELECT 
  pid
, uid
, name
, ci.model
, ci.number_of_cores
, ci.logical_processors
, ci.max_clock_speed
, ci.number_of_efficiency_cores
, ci.number_of_performance_cores
, ROUND((
  (user_time + system_time) / (cpu_time.tsb - cpu_time.itsb)
) * 100, 2) AS percentage
FROM processes,(
SELECT (
  SUM(user) + SUM(nice) + SUM(system) + SUM(idle) * 1.0) AS tsb,
  SUM(COALESCE(idle, 0)) + SUM(COALESCE(iowait, 0)) AS itsb
  FROM cpu_time
) AS cpu_time
 cross join cpu_info as ci
ORDER BY user_time+system_time DESC
LIMIT 20;

The above query cross joins the processes table and the cpu_info table to get some basic CPU usage and context of the CPU data. I found this query from a blog found here. I also found that blog post pretty informative around some performance monitoring concepts with osquery. So, we loaded this query up in FleetDM and let it run to see what we got back.

  1
  2
  3
  4
  5
  6
  7
  8
  9
 10
 11
 12
 13
 14
 15
 16
 17
 18
 19
 20
 21
 22
 23
 24
 25
 26
 27
 28
 29
 30
 31
 32
 33
 34
 35
 36
 37
 38
 39
 40
 41
 42
 43
 44
 45
 46
 47
 48
 49
 50
 51
 52
 53
 54
 55
 56
 57
 58
 59
 60
 61
 62
 63
 64
 65
 66
 67
 68
 69
 70
 71
 72
 73
 74
 75
 76
 77
 78
 79
 80
 81
 82
 83
 84
 85
 86
 87
 88
 89
 90
 91
 92
 93
 94
 95
 96
 97
 98
 99
100
101
102
103
104
105
106
107
108
109
110
111
112
113
114
115
116
117
118
119
120
121
122
123
124
125
126
127
128
129
130
131
132
133
134
135
136
137
138
139
140
141
142
143
144
145
146
147
148
149
150
151
152
153
154
155
156
157
158
159
160
161
162
163
164
165
166
167
168
169
170
171
172
173
174
175
176
177
178
179
180
181
182
183
184
185
186
187
188
189
190
191
192
193
194
195
196
197
198
199
200
201
202
203
204
205
206
207
208
209
210
211
212
213
214
215
216
217
218
219
220
221
222
223
224
225
226
227
228
229
230
231
232
233
234
235
236
237
238
239
240
241
242
243
244
245
246
247
248
249
250
251
252
253
254
255
256
257
{
  "action": "snapshot",
  "calendarTime": "Wed Aug 30 17:31:16 2023 UTC",
  "counter": 0,
  "decorations": {
    "host_uuid": "UUID string",
    "hostname": "the-host-name",
    "serial_number": "the-serial-number"
  },
  "epoch": 0,
  "hostIdentifier": "UUID-string",
  "name": "pack/Global/ingest-macos-top-20-processes",
  "numerics": false,
  "snapshot": [
    {
      "logical_processors": "10",
      "max_clock_speed": "3228",
      "model": "Apple M1 Max",
      "name": "WindowServer",
      "number_of_cores": "10",
      "number_of_efficiency_cores": "2",
      "number_of_performance_cores": "8",
      "percentage": "204.99000000000001",
      "pid": "565",
      "uid": "0"
    },
    {
      "logical_processors": "10",
      "max_clock_speed": "3228",
      "model": "Apple M1 Max",
      "name": "kernel_task",
      "number_of_cores": "10",
      "number_of_efficiency_cores": "2",
      "number_of_performance_cores": "8",
      "percentage": "123.26000000000001",
      "pid": "0",
      "uid": "0"
    },
    {
      "logical_processors": "10",
      "max_clock_speed": "3228",
      "model": "Apple M1 Max",
      "name": "<redacted>",
      "number_of_cores": "10",
      "number_of_efficiency_cores": "2",
      "number_of_performance_cores": "8",
      "percentage": "62.219999999999999",
      "pid": "12800",
      "uid": "0"
    },
    {
      "logical_processors": "10",
      "max_clock_speed": "3228",
      "model": "Apple M1 Max",
      "name": "AdobeReader",
      "number_of_cores": "10",
      "number_of_efficiency_cores": "2",
      "number_of_performance_cores": "8",
      "percentage": "48.670000000000002",
      "pid": "78967",
      "uid": "501"
    },
    {
      "logical_processors": "10",
      "max_clock_speed": "3228",
      "model": "Apple M1 Max",
      "name": "Google Chrome",
      "number_of_cores": "10",
      "number_of_efficiency_cores": "2",
      "number_of_performance_cores": "8",
      "percentage": "32.32",
      "pid": "1667",
      "uid": "501"
    },
    {
      "logical_processors": "10",
      "max_clock_speed": "3228",
      "model": "Apple M1 Max",
      "name": "Google Chrome Helper (GPU)",
      "number_of_cores": "10",
      "number_of_efficiency_cores": "2",
      "number_of_performance_cores": "8",
      "percentage": "28.050000000000001",
      "pid": "1767",
      "uid": "501"
    },
    {
      "logical_processors": "10",
      "max_clock_speed": "3228",
      "model": "Apple M1 Max",
      "name": "redacted",
      "number_of_cores": "10",
      "number_of_efficiency_cores": "2",
      "number_of_performance_cores": "8",
      "percentage": "21.800000000000001",
      "pid": "70254",
      "uid": "0"
    },
    {
      "logical_processors": "10",
      "max_clock_speed": "3228",
      "model": "Apple M1 Max",
      "name": "launchd",
      "number_of_cores": "10",
      "number_of_efficiency_cores": "2",
      "number_of_performance_cores": "8",
      "percentage": "19.34",
      "pid": "1",
      "uid": "0"
    },
    {
      "logical_processors": "10",
      "max_clock_speed": "3228",
      "model": "Apple M1 Max",
      "name": "distnoted",
      "number_of_cores": "10",
      "number_of_efficiency_cores": "2",
      "number_of_performance_cores": "8",
      "percentage": "16.460000000000001",
      "pid": "867",
      "uid": "501"
    },
    {
      "logical_processors": "10",
      "max_clock_speed": "3228",
      "model": "Apple M1 Max",
      "name": "Google Chrome Helper (Renderer)",
      "number_of_cores": "10",
      "number_of_efficiency_cores": "2",
      "number_of_performance_cores": "8",
      "percentage": "15.69",
      "pid": "40686",
      "uid": "501"
    },
    {
      "logical_processors": "10",
      "max_clock_speed": "3228",
      "model": "Apple M1 Max",
      "name": "bluetoothd",
      "number_of_cores": "10",
      "number_of_efficiency_cores": "2",
      "number_of_performance_cores": "8",
      "percentage": "11.039999999999999",
      "pid": "557",
      "uid": "0"
    },
    {
      "logical_processors": "10",
      "max_clock_speed": "3228",
      "model": "Apple M1 Max",
      "name": "distnoted",
      "number_of_cores": "10",
      "number_of_efficiency_cores": "2",
      "number_of_performance_cores": "8",
      "percentage": "9.7799999999999994",
      "pid": "548",
      "uid": "241"
    },
    {
      "logical_processors": "10",
      "max_clock_speed": "3228",
      "model": "Apple M1 Max",
      "name": "redacted",
      "number_of_cores": "10",
      "number_of_efficiency_cores": "2",
      "number_of_performance_cores": "8",
      "percentage": "9.7300000000000004",
      "pid": "1875",
      "uid": "501"
    },
    {
      "logical_processors": "10",
      "max_clock_speed": "3228",
      "model": "Apple M1 Max",
      "name": "RdrCEF Helper (GPU)",
      "number_of_cores": "10",
      "number_of_efficiency_cores": "2",
      "number_of_performance_cores": "8",
      "percentage": "8.6099999999999994",
      "pid": "78987",
      "uid": "501"
    },
    {
      "logical_processors": "10",
      "max_clock_speed": "3228",
      "model": "Apple M1 Max",
      "name": "mds_stores",
      "number_of_cores": "10",
      "number_of_efficiency_cores": "2",
      "number_of_performance_cores": "8",
      "percentage": "7.6900000000000004",
      "pid": "847",
      "uid": "0"
    },
    {
      "logical_processors": "10",
      "max_clock_speed": "3228",
      "model": "Apple M1 Max",
      "name": "Google Chrome Helper",
      "number_of_cores": "10",
      "number_of_efficiency_cores": "2",
      "number_of_performance_cores": "8",
      "percentage": "7.5",
      "pid": "1769",
      "uid": "501"
    },
    {
      "logical_processors": "10",
      "max_clock_speed": "3228",
      "model": "Apple M1 Max",
      "name": "Google Chrome Helper (Renderer)",
      "number_of_cores": "10",
      "number_of_efficiency_cores": "2",
      "number_of_performance_cores": "8",
      "percentage": "6.5800000000000001",
      "pid": "55884",
      "uid": "501"
    },
    {
      "logical_processors": "10",
      "max_clock_speed": "3228",
      "model": "Apple M1 Max",
      "name": "mds",
      "number_of_cores": "10",
      "number_of_efficiency_cores": "2",
      "number_of_performance_cores": "8",
      "percentage": "6.0700000000000003",
      "pid": "523",
      "uid": "0"
    },
    {
      "logical_processors": "10",
      "max_clock_speed": "3228",
      "model": "Apple M1 Max",
      "name": "coreaudiod",
      "number_of_cores": "10",
      "number_of_efficiency_cores": "2",
      "number_of_performance_cores": "8",
      "percentage": "5.9100000000000001",
      "pid": "580",
      "uid": "202"
    },
    {
      "logical_processors": "10",
      "max_clock_speed": "3228",
      "model": "Apple M1 Max",
      "name": "redacted",
      "number_of_cores": "10",
      "number_of_efficiency_cores": "2",
      "number_of_performance_cores": "8",
      "percentage": "5.0300000000000002",
      "pid": "53600",
      "uid": "0"
    }
  ],
  "unixTime": 1693416676
}

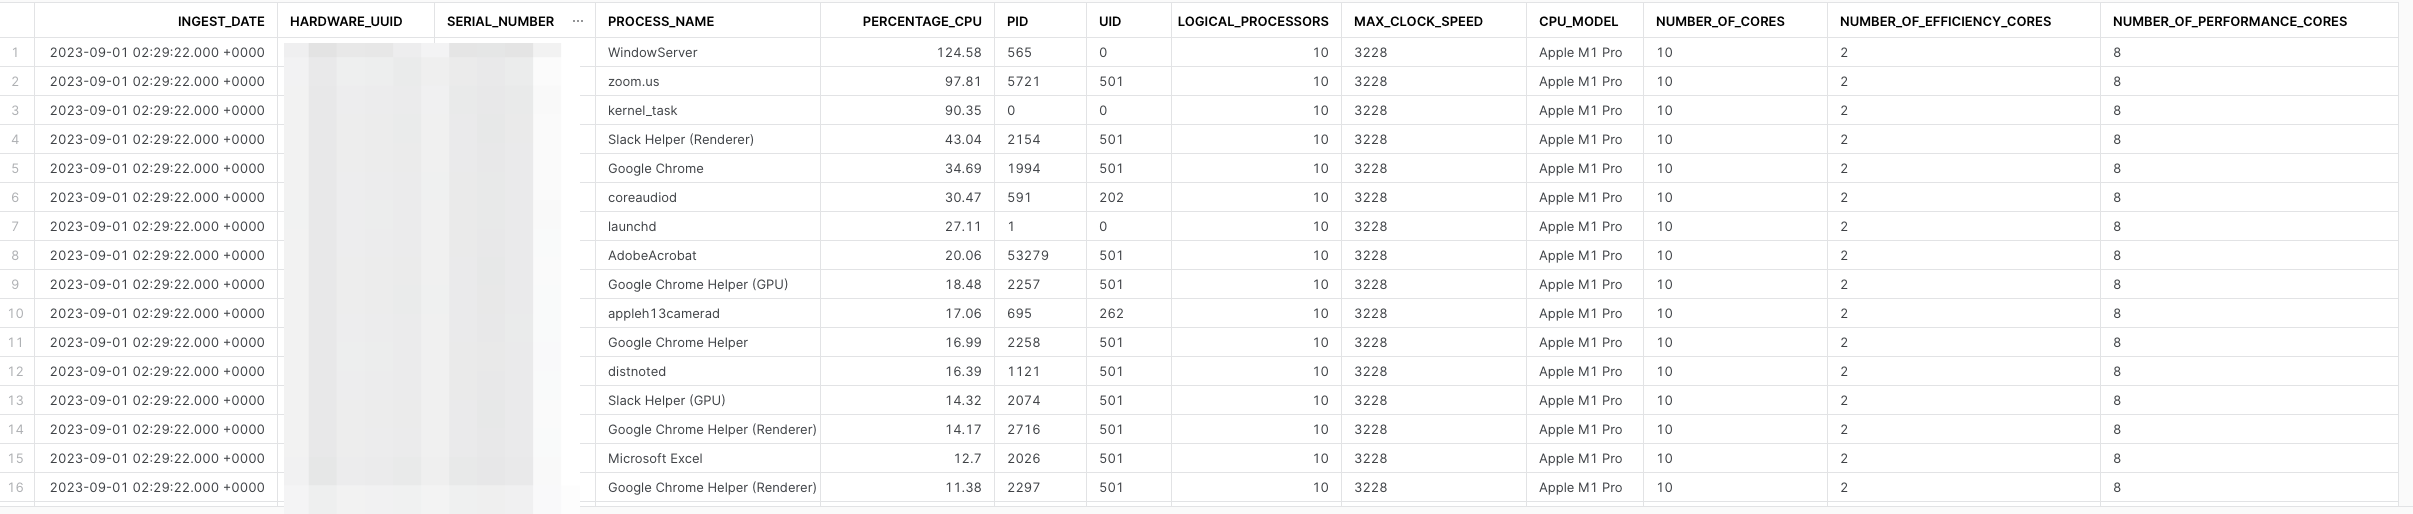
When you automate a query in FleetDM, it puts the query in the Global Query Pack, and it uses the name of the query in FleetDM as the name of the query locally on the client. In the future I might dive deeper into the architecture, but for now I want to mention the query name as we will use this for a data model in Snowflake. Automated queries in FleetDM can be setup to stream to cloud storage, like S3 over AWS Kinesis Firehose, and the results are stored in JSON files like the example above. Snowflake can natively parse semi structured data, which is referred to as variant data

Furthermore, Snowflake has a feature called Flatten. Which is essentially a table function that allows you to “flatten” keys and values in a JSON file into columns and values. It is quite the handy and powerful feature for IT Ops folks as we deal with JSON data structures in so many things. So, one could apply some of these concepts with REST APIs and JSON returns that one could ingest into Snowflake as well.

 1
 2
 3
 4
 5
 6
 7
 8
 9
10
11
12
13
14
15
16
17
18
19
20
create or replace view DB.SCHEMA.OSQR_TOP_20_PROCS_MACOS_HISTORICAL as (
select
  raw:unixTime::string::timestamp_ltz as ingest_date
, raw:decorations:host_uuid::string as hardware_uuid
, raw:decorations:serial_number::string as serial_number
, f.value:name::string as process_name
, f.value:percentage::float as percentage_cpu
, f.value:pid::string as PID
, f.value:uid::string as UID
, f.value:logical_processors::integer as logical_processors
, f.value:max_clock_speed::string as max_clock_speed
, f.value:model::string as cpu_model
, f.value:number_of_cores::string as number_of_cores
, f.value:number_of_efficiency_cores::string as number_of_efficiency_cores
, f.value:number_of_performance_cores::string as number_of_performance_cores
from DB.SCHEMA.FLEET_OSQUERY_RESULTS
, lateral flatten(input => "RAW":"snapshot") as f
where raw:name::string = 'pack/Global/ingest-macos-top-20-processes'
)
;
Things to Note in the above query
  • Since FleetDM streams query results to a single raw data table we are using where raw:name::string = 'pack/Global/ingest-macos-top-20-processes' to filter the data for this specific query
  • Flatten was aliased as f and we use simple built-in features to get the value of a key in the original JSON query results
  • Type casting each value is important, we probably don’t want the data view to use variant data types, but rather specific data types
  • Remember this is snapshot data, not historical. These are CPU usage spikes we do not know how long the process ran for
  • When data modeling, try to keep the view specific and avoid joining every data source into a single monolithic view
  • When updating a view, you may want to use copy grants

Sample query from the view we created:

/img/blog-processes-results.png

Let’s have some fun, what is the CPU spike for virtual machines across our fleet? Remember this is just most CPU intestine processes since boot, as we do not have events data to get a more accurate data sample. We are in the beginning of our data journey here.

1
2
3
4
5
select * from DB.SCHEMA.TOP_20_PROCS_MACOS_HISTORICAL
where process_name = 'com.apple.Virtualization.VirtualMachine'
and cpu_model is not NULL
order by percentage_cpu desc
limit 1000;
Things to Note in the above query
We can now query the view we created with simple SQL. This means it is accessible and easy to use when you data share this data across your org. Early JSON files from FleetDM had different data as we were experimenting with the query, so we know the earlier test data had NULL values, we just want to filter those out.

The results:

/img/blog-vm-proc-data.png

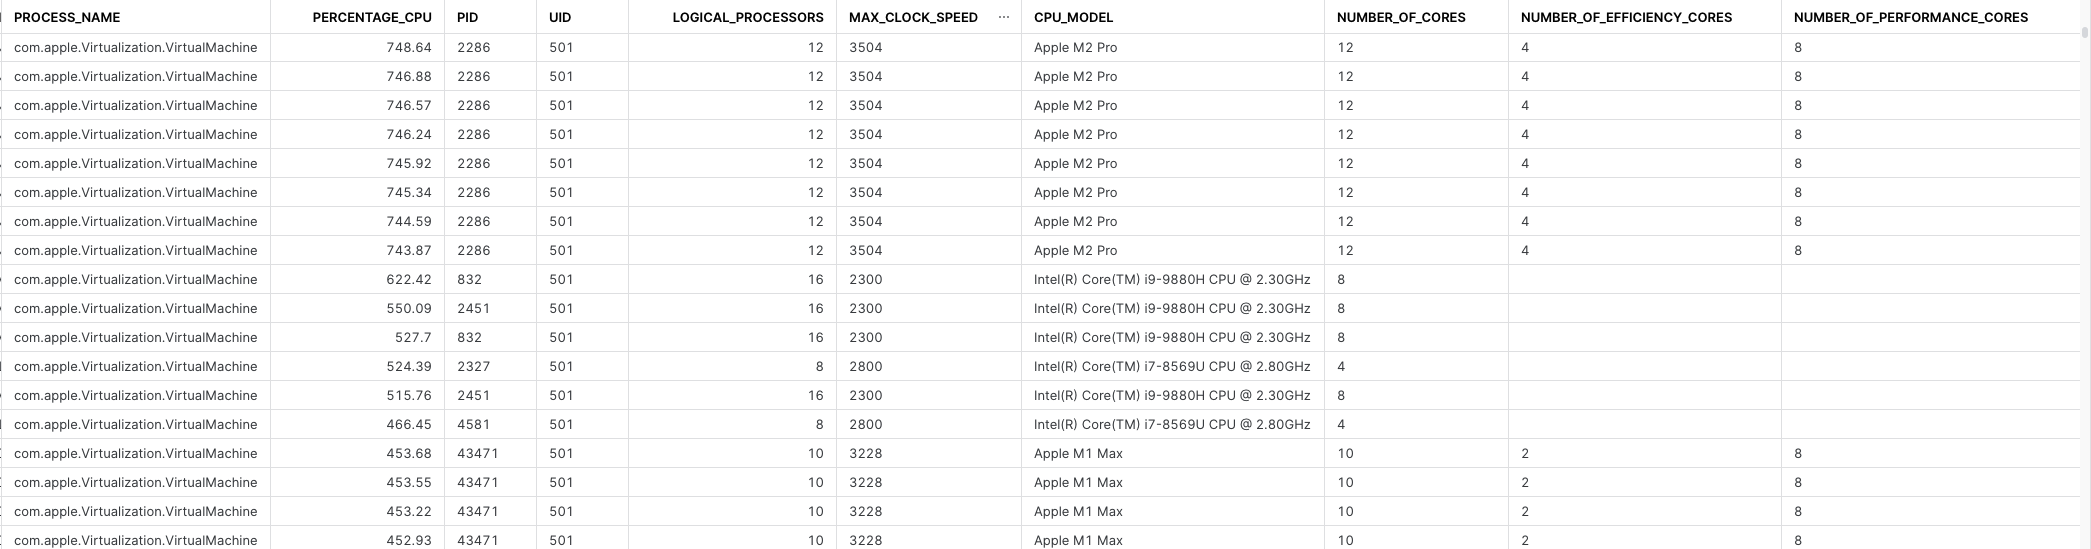
So, now we have some info around peak compute local VMs take across our fleet, what model of CPU and compute specs the device has, and we can also join this data to other data sources to enrich it. We could join asset data from ServiceNow and filter for assets actually in production use, we could also join it to HR data to apply what human is using this device, and of course we can join many other data sets in Snowflake to this.

Consider this osquery query:

1
select * from temperature_sensors;

A simple one liner in FleetDM will have osquery return the entire contents of the temperature_sensors table. That is all we really need to do here, it is that simple. There are some osquery configurations we are adding via FleetDM as well, most noteworthy is we are adding in the hardware serial number of the device as a decorator. This is simply to ensure the serial number is in every query results and can be used as a primary key we will use later downstream in Snowflake.

Yet another simple data model in Snowflake:

 1
 2
 3
 4
 5
 6
 7
 8
 9
10
11
12
13
create or replace view DB.SCHEMA.OSQR_MAC_TEMPS_HISTORICAL_V as (select 
raw:decorations.serial_number::string as serial_number
, raw:unixTime::string::timestamp_ltz as ingest_time
, raw:decorations.hostname::string as hostname
, f.value:name::string name
, f.value:key::string key
, f.value:celsius::float celsius
, f.value:fahrenheit::float fahernheit
from DB.SCHEMA.FLEET_OSQUERY_RESULTS
, lateral flatten(input => "RAW":"snapshot") as f
where raw:name::string = 'pack/Global/ingest-macos-temp-sensors'
)
;

As well as some cool (or hot to toss in a dad joke there) data results in Snowflake!

/img/blog-temp-sensors.png

Things to Note in the above results
I have noticed some values that are negative integers, like that -
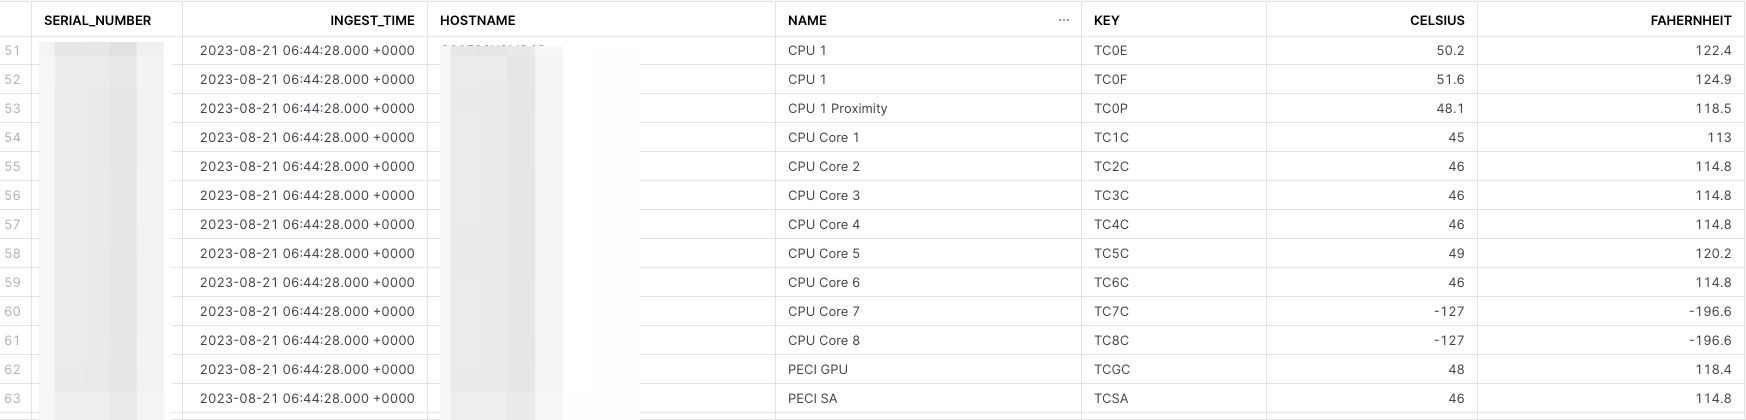
127. I believe these to be a default value when a sensor is not present or perhaps not functioning. I have not fact-checked this yet, but I know from my experience building gaming PCs and constantly looking at temperature sensors, if you see a static value that looks off, that is oftentimes a default value when a sensor is either not hooked up or missing, or not functioning.

Searching Apple’s website I did find this article which tells me I should operate my Mac with in a certain ambient temperature range, but I failed to find an article that stated what the acceptable internal temperatures should be. Typically, with gaming hardware, like a higher end GPU you don’t want temps going over 90 degrees Celsius, but that is x86 and PC hardware. So I am not advocating that to be the line you don’t want to cross. If anyone has a link to an official Apple document that states internal temperature thresholds I would love to know!

What we can do with this data is trend it over time, and establish a baseline. If we take several months of temperature sensor data, organize it by hardware type (make/model), user type (developer, pro services, sales, IT, etc), and trend average temperatures we can at least establish a baseline. From there we can create alerts or automated ticket creation in ServiceNow to proactively reach out to users if we detect spikes in their internal temperature of their laptop. We should be able to determine that the average IT worker using a M1 CPU operates in this temperature threshold, and use that for a baseline of acceptable temperatures for all IT workers that have that same model.

Closing thoughts

We have more data coming in I did not cover yet. Things like browser extensions, application versions, systems data, how much memory is being consumed by what process, and more. We aren’t as tenured as some Orgs with osquery, but better late than never as they say! This is the beginning of this journey, and I would bet more blog posts will come from this.

If you got this far, thanks for reading! Here is a bonus pic of Booms when we took him to see some mountains along the Pacific Ocean.

/img/happiest-boi-ever.jpg